Since the beginning of the year, I’ve been tracking every utility trip I make – how, why and how far. The exercise has been inspired by different bits of reading I’ve done on where e-scooters fit in the mix of travel modes. I thought based on others’ experience that it might be a neighbourhood runabout or a last-mile option, which I think has been largely borne out by the numbers. My goal is to track every trip this year: this is a mid-year update.
Context matters, and I’ll just say that I live in an amenity-dense part of town: a true 15-minute community. I’m served by a light rail stop 850m away and a plethora of bus routes a quick walk from my house. I’m able to get to safe, segregated citywide spine route bike infrastructure quickly and on low-volume, low-speed streets. My office is in the core of the city roughly 5 km away served with a short walk by LRT and I have virtually door-to-door bus service to it in addition to a relatively direct safe, fast cycling connection. My work takes me through my neighbourhood with destinations at most two or three kilometres away, mostly served with direct bus routes.
Generally speaking, for most of the destinations to which I’m headed I have a reasonable choice of walking, LRT, bus, bike or scooting. I’m very fortunate to live where I do – a choice that was made in a different housing market than today.
Methodology notes
In order to track my travel, I’ve been using a Google Sheet, into which I can plug each trip using a linked Google Form. I tried this last year with a more comprehensive form, but it became too much of a chore. This year, the form is stripped down capturing just the postal code for my origin and destination, the postal code of any stops I make along the way, which mode or modes I used, if I was in a private vehicle, the number of passengers, and why I was travelling. My most frequent destinations are listed as radio buttons.
Distances are calculated automatically in my Sheet using Google driving distances between postal codes for consistency. Not every trip conforms to the calculated distance. I’ll often take the scenic route home on my bike, and the absolute distance when using multiple travel modes can be longer than calculated. My goal isn’t to track how far I’ve gone, but a consistent measure of how far away something is, I think, helps me derive insight from the numbers.
One of the choices I’ve had to make to, again, reduce the work involved in tracking is to define a trip. I couldn’t keep up with inputting every leg of travel, so I now use a definition of a “trip” that gets a little loose. In my tracking, I input a trip as going to a destination where I stay for a while (such as going to work, attending a meeting or event, or visiting a friend), or, if making several stops of similar duration in a series of errands, getting to the point that is furthest away from my origin. So, leaving from work and stopping at the market on my way home is a “trip”. I think this captures one of the key elements for my modal choice: distance from my origin.
Finally, by way of introduction, I should say that I am fortunate to be able to afford multiple modes of travel. Hoofing it, of course, is available to most and the ability to easily walk to the drug store, library, groceries, hardware store and other amenities is a key reason we chose to live in this neighbourhood. I also have a bike for which I have pannier bags. I’ve gone through a series of e-kick scooters and believe I’ve finally found one that is reliable – a high-end dual 1000w motor beast to which I’ve had to make no repairs through the first 500 kms. It was expensive, but the cheaper models I’d purchased previously were unreliable, subject to frequent flats, under-powered for city traffic and in one case unrepairable. I have a car and actually enjoy driving although I tend not to want to to avoid congestion and parking hassles. Finally, I have an employer-provided transit pass. I’ll just say that I’m a lifelong transit user, having grown up largely in the suburbs and have always had a pass. Ottawa has recently implemented fare-capping for debit and credit payment of fares and the cost of transit is less of a consideration for me than other reasons for choosing the bus or LRT.
Mode considerations
When I began tracking this year, I’d had a couple of years of experience with scooters and had a good idea of when I was likely to choose one mode of travel over another. I can summarize those expected choices as follows.
Walking
I live within a close walk of many of my day-to-day destinations. For many of those, weather is not a consideration, although as the distance climbs to be more than, say, 600 meters I start to look at alternatives. I have not been kind to my legs over the years, and a longer walk can be uncomfortable for me. Weather, particularly heat, plays a role at around that distance in terms of choosing to bike or, more likely, scoot instead. On the other hand, I’ll usually default to walking when it’s raining, or in extreme cold; doing a short bike distance when it’s -26C doesn’t make sense given the riding gear I need to don. I’m limited in what I can carry, of course, to a large backpack and what I can hold when I walk. After a couple of trips recently that would have been silly to reach any way other than on foot, but constrained in what I could carry, I bought a wagon to overcome that limitation.
Scooting
I set out tracking expecting scooting might be a neighbourhood runabout mode choice. Scooting is virtually effortless and it’s possibly the fastest way I can get around closer to home. I can wear a suit. I’m fast enough to keep up with traffic, and when things slow down on the road I can travel more like a cyclist to get around bottlenecks. Although it’s not usually a consideration in how I travel, I do restrict myself to the street – the scooter is simply too fast and heavy to share bike infrastructure or on multi-use paths shared with pedestrians. I don’t want to slow my scooter to 15 km/h when it will travel 55. I love how nimble the scooter is: there’s no friction bringing it out of my garage and getting underway. The biggest restrictions are weather-related. I don’t feel comfortable using it in the winter both for safety reasons and the effects of road salt. I also don’t use it in the rain since I’ve noticed a significant diminishment of stopping ability in wet conditions. Battery life might be a consideration although I’ve never used more than half the power even scooting around town for with both motors cranked up. Generally speaking if I’m going to a destination further away with my scooter, I’ll use it as a last-mile device and cut out the middle distance by using LRT. Sometimes, though, if I have time constraints I’ll scoot the whole way for example to get to the office. Cargo capacity can sometimes be an issue – I’m limited generally to what I can carry in a large backpack.
Cycling
As noted below, cycling is how I get around most. It’s faster than walking or transit and depending on parking considerations, traffic and distance, often faster than driving. I have pannier bags that carry most of what I ever want to carry. I can use it in all weather conditions. It’s reliable with maybe one service call each year that costs a few hundred bucks since I’m hard on it and ride it all winter. Inter-neighbourhood bike infrastructure is increasingly excellent and keeps me out of traffic, although I’m also comfortable on the traditional mainstreets (less so on arterials). Of course, cycling is also self-care. I won’t belabour the mental and physical health benefits of regular cycling. As tempting as it might be to scoot to work, I choose to bike instead and often in the fair-weather months extend my ride to various scenic, even inspiring, routes. As a last-mile solution it can go on both the bus (with rack-and-roll, my scooter is too heavy to easily lift) or the train. There are downsides, though. I’m uncomfortable cycling in my work clothes and getting sweaty. While I usually change quickly at the office, there are some events and meetings off-site that I attend when a quick change isn’t easy and I might choose transit or my scooter instead. It’s harder work in extreme cold or against a strong headwind and some days are harder to face than others. Finally, and this is a small thing, it’s a hassle getting my bike in and out of the garage depending how the car is parked in our sloped driveway.
Driving
As noted above, there’s a lot I love about driving. I drive stick and am conscious of how I’m driving and it’s a source of pleasure to me. With the windows down and some good tunes playing, I don’t mind normal driving conditions even if traffic is sometimes frustrating when I’m comfortably seated. Just about the only way I can decompress at the beginning of a vacation is with a long drive. I hate parking. I hate the expense of filling up and of servicing. I am very cognizant of what my choice to drive is doing to the environment. As a cyclist I’m also concerned about the consequences of what a lapse in judgment can mean on busy streets. On balance, I try to drive as little as possible. My partner as of last year has had an e-assist bike and we’re increasingly cycling for utility, but she’s not up for longer cycles. The majority of my driving trips below are she and I traveling to her parents 9 kms away. There are other destinations to which I can’t cycle given time constraints. I’m pretty successful at rarely doing a single-passenger occupancy trip, but I do make some of those trips for shopping or work.
By the numbers
This mid-year wrap-up is for the first six months of 2024 – January 1 to June 30. It became safe enough to start using my scooter on March 27, which makes it easy to look at two roughly equal periods, pre-scooter and post-scooter (when my scooter has been on the road), each about half the period.
The top-line I wanted to look at is how the mode share changes for each of cycling, scooting, transit, walking and driving between the pre- and post-scooter periods. I’m also really interested in what that picture looks like with commuting taken out. Over the period I’m looking at, I did 607 trips. Roughly three quarters of my commutes without any other stops or purpose are done by bike, and bike commutes with no other purpose are roughly 15% of my total trips.
There are some significant differences in my mode share when looking at pre- and post-scooter commuting.

Cycling share
When looking at all trips, all trips that include my bike are the highest share. Just about one-third of the trips I’ve taken since January 1 have included my bike, whether that’s as a straight cycle not combined with any other mode, a bike and transit (either LRT or rack-and-roll) combined trip, or some other multi-modal combination. When I first started tracking, I thought multi-modal travel would be a higher share, but as it turns out just one-in-eight of my trips combine modes. Consequently, I haven’t delved deep into that number in this post.
Commutes are a big skew in the bike share of total. When commutes are removed, all trips that include my bike fall to 20% of my total trips. That falls a little more in the period during which I had my scooter available to me and with commutes removed to 18.5%. When I look at all bike trips including commutes pre- and post-scooter, the share of total falls from 38.5% to 28.7%. Clearly, my scooter is replacing some bike trips.
Transit trips pre- and post-scooter are where I see the biggest swing, though.
Transit share
On the whole, all trips involving transit (either bus or LRT, and combined with some other mode) are one-quarter of my total. Pre-scooter, that number was 37%, virtually the same as the cycling share pre-scooter. With commutes removed and only looking at the pre-scooter period, all trips with transit was my highest share at 42%. Those numbers fall drastically once my scooter gets introduced into the mix. Looking at just the post-scooter period, all trips with transit plummets to 18%, the same as with commutes removed.
The conclusion is pretty inescapable: for non-commuting trips my scooter has replaced a very significant portion of my transit use.
By way of anecdata, what I can say to illustrate this point is that there is a type of in-neighbourhood trip that, during the winter, I’m often likely to take by bus that is much easier and more convenient by scooter. I live on the eastern edge of a city ward that stretches mostly east-west for about 3 kms along a commercial and institutional stretch. My job frequently takes me to destinations further west in this geography along this stretch and there’s a number of shops at which I’m a customer. A relatively frequent bus route serves that stretch and during the winter when roads are congested and icy I trade off speed for ease and convenience by taking that bus. OC Transpo’s switch to the Transit app for bus tracking and trip planning has been a game-changer with respect to reducing my wait times. For destinations west but south of me – for example the Dovercourt Recreation Centre to which I’m a frequent visitor – there is a direct connection from close by my house. Transit is still my main choice when weather rules out scooting, but scooting saves a very significant amount of time getting to those destinations: thus, the wholesale switchover.
Walking (single-mode)
The least variable mode over the last six months has been walking (without combination with another mode). There’s a slightly discernible difference between pre- and post-scooter periods, falling from 28.4% to 24.5%. I think that’s the result of switching to my scooter for some grey area distances. As demonstrated in the tables below, my average walking distance for a non-commute trip was 710m in the pre-scooter period. That falls to 480m for the post-scooter period for non-commuting trips. My average scooter distance without commutes is 1.9 kms. Somewhere between that 480m and 1.9kms is a decision-point between walking and scooting that I suspect is weather-related. In the scatter plot below of my four main modes of travel (without multi-modal trips), it’s clear the number of walking trips I make further than 1km are pretty limited.

Private vehicle
Of the four main ways I have to travel, I drive the least. There are few enough trips in that category, 9% of my non-commuting trips, 7.2% of my total trips, I’m not confident that any change in share is meaningful between pre- and post-scooter periods. Driving trip distance averages 9.45 kms and that’s heavily weighted by trips to my in-laws’ with Natalie; the average occupancy of the vehicles in which I’ve travelled during this period has been 1.84. Driving is something I do infrequently, generally with Natalie, and for distances that I wouldn’t scoot or bike. There are some longer trips in my multi-modal travel log, but those aren’t frequent. Generally most of the destinations to which I would ordinarily travel are within my community or in the city core where I would normally choose active or public transit or some combination thereof.
Multi-stop and multi-modal travel
In the tables below I’ve recreated the multi-stop and multi-modal numbers. They don’t, bluntly, look interesting enough to explore in any depth. When I’m travelling by bus or LRT, there’s a higher number of stops, but I think some of that may be ascribable to the trip I’ll make reasonably frequently to the Rideau Centre on Sunday mornings to pick up a paper and drop in to Farm Boy and Shoppers Drug Mart. Depending on weather, that’s a trip I prefer to do by bike, but the 14 gives me a door-to-door connection and I’ve got multiple options to get home including the 11 and LRT. I think there might something interesting to look at with respect to my average trips per day. With the warm weather I’m travelling more often. I think I’m more likely not to actively try to bundle trips together since walking or scooting around the neighbourhood is fun and easy in summer. In winter, I’ll do a multi-stop trip more often so that I can wrap up my day and stay inside once I get inside.
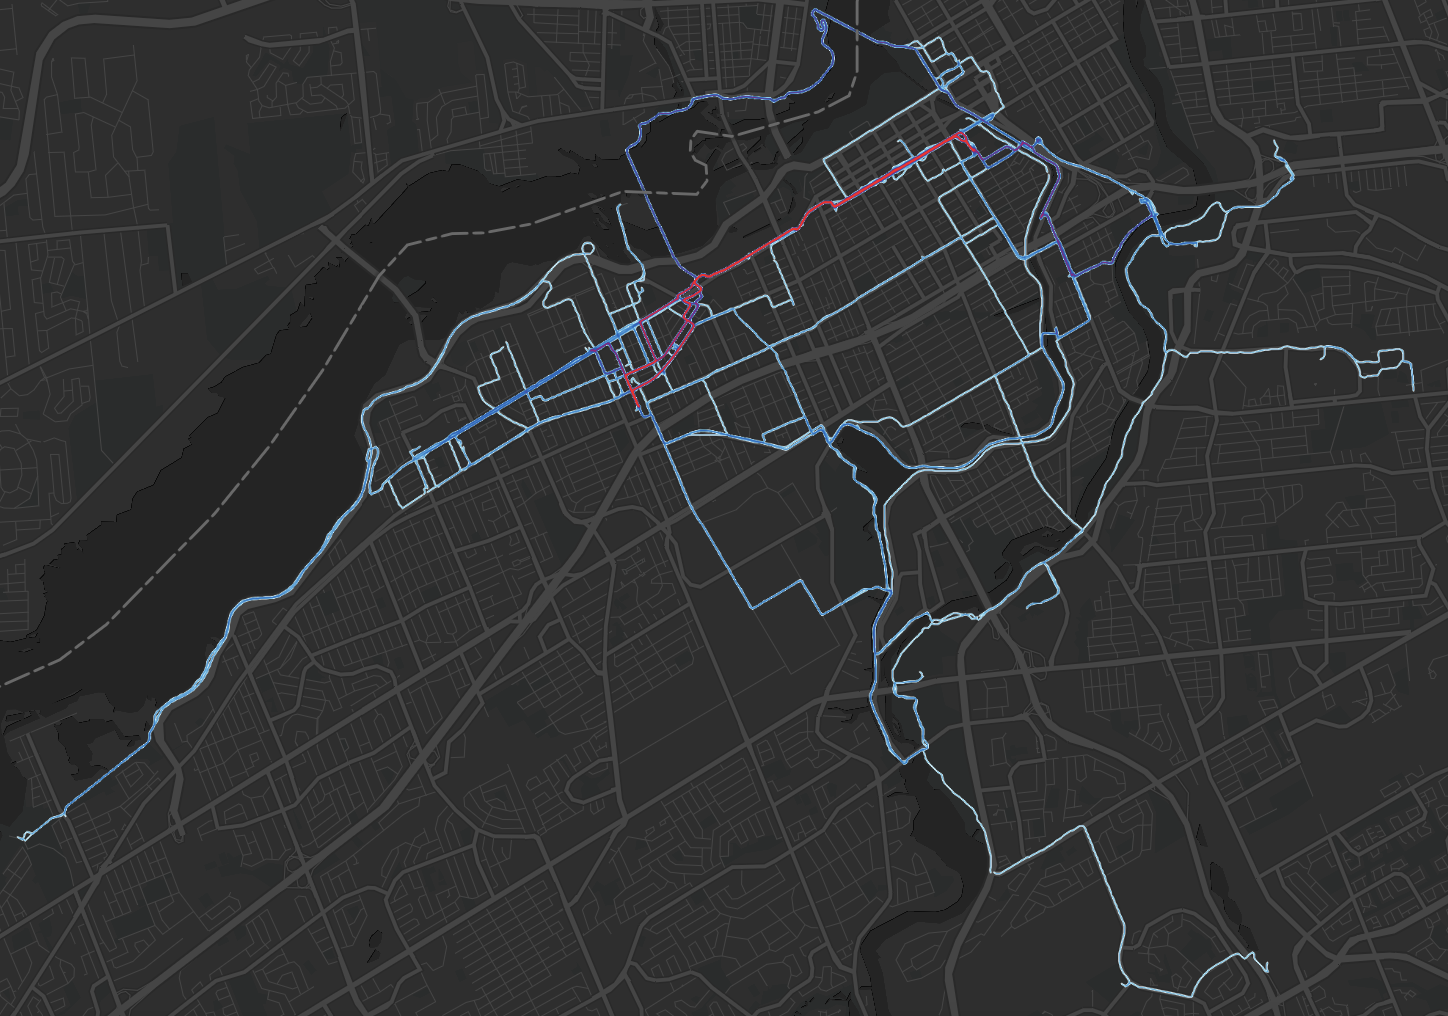
Strava cycling heat map
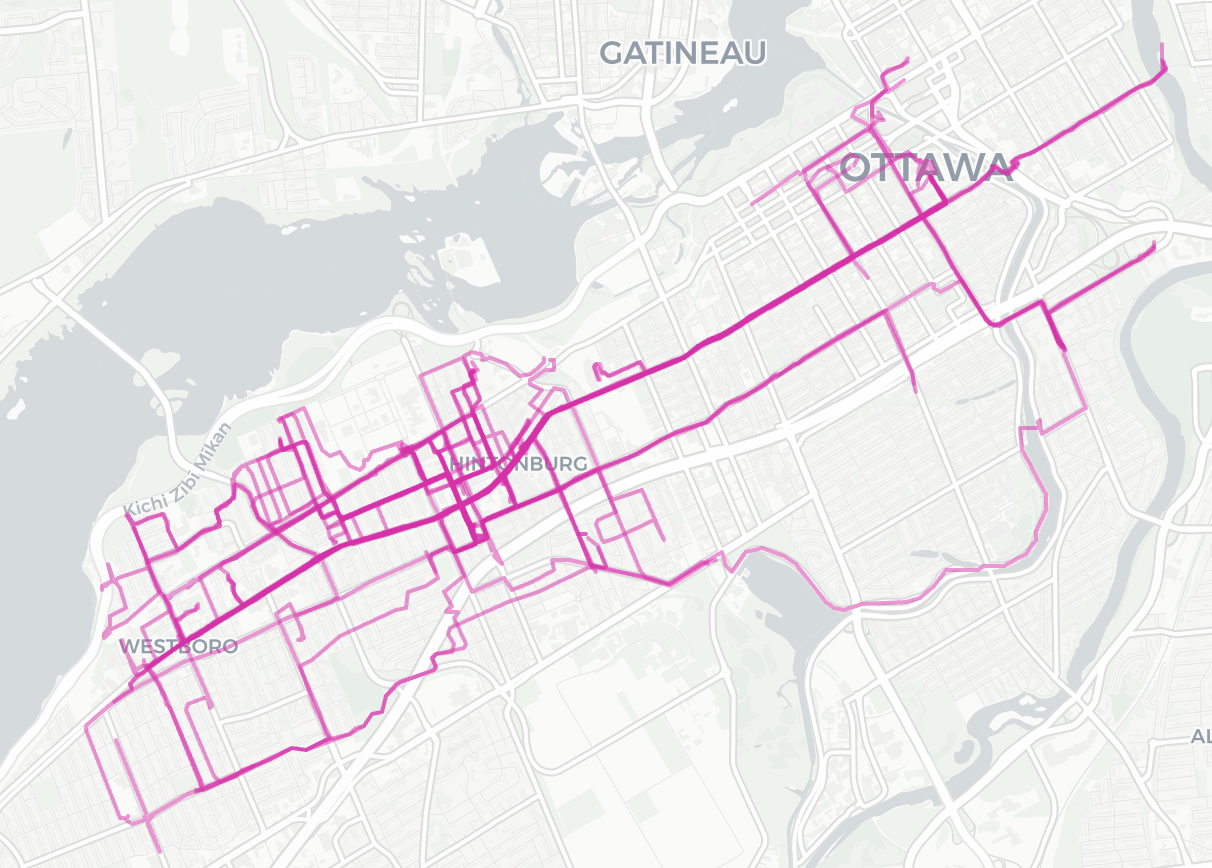
Derive scooting heat map